Live Updates arrow
Account Login
search-icon
Close

Groundwater

Simply put, groundwater is water that is stored beneath the ground. Much of our drinking water comes from groundwater but it can also cause problems during wetter months. Learn more about groundwater and view the latest groundwater levels across the region.

background

Groundwater and why it matters

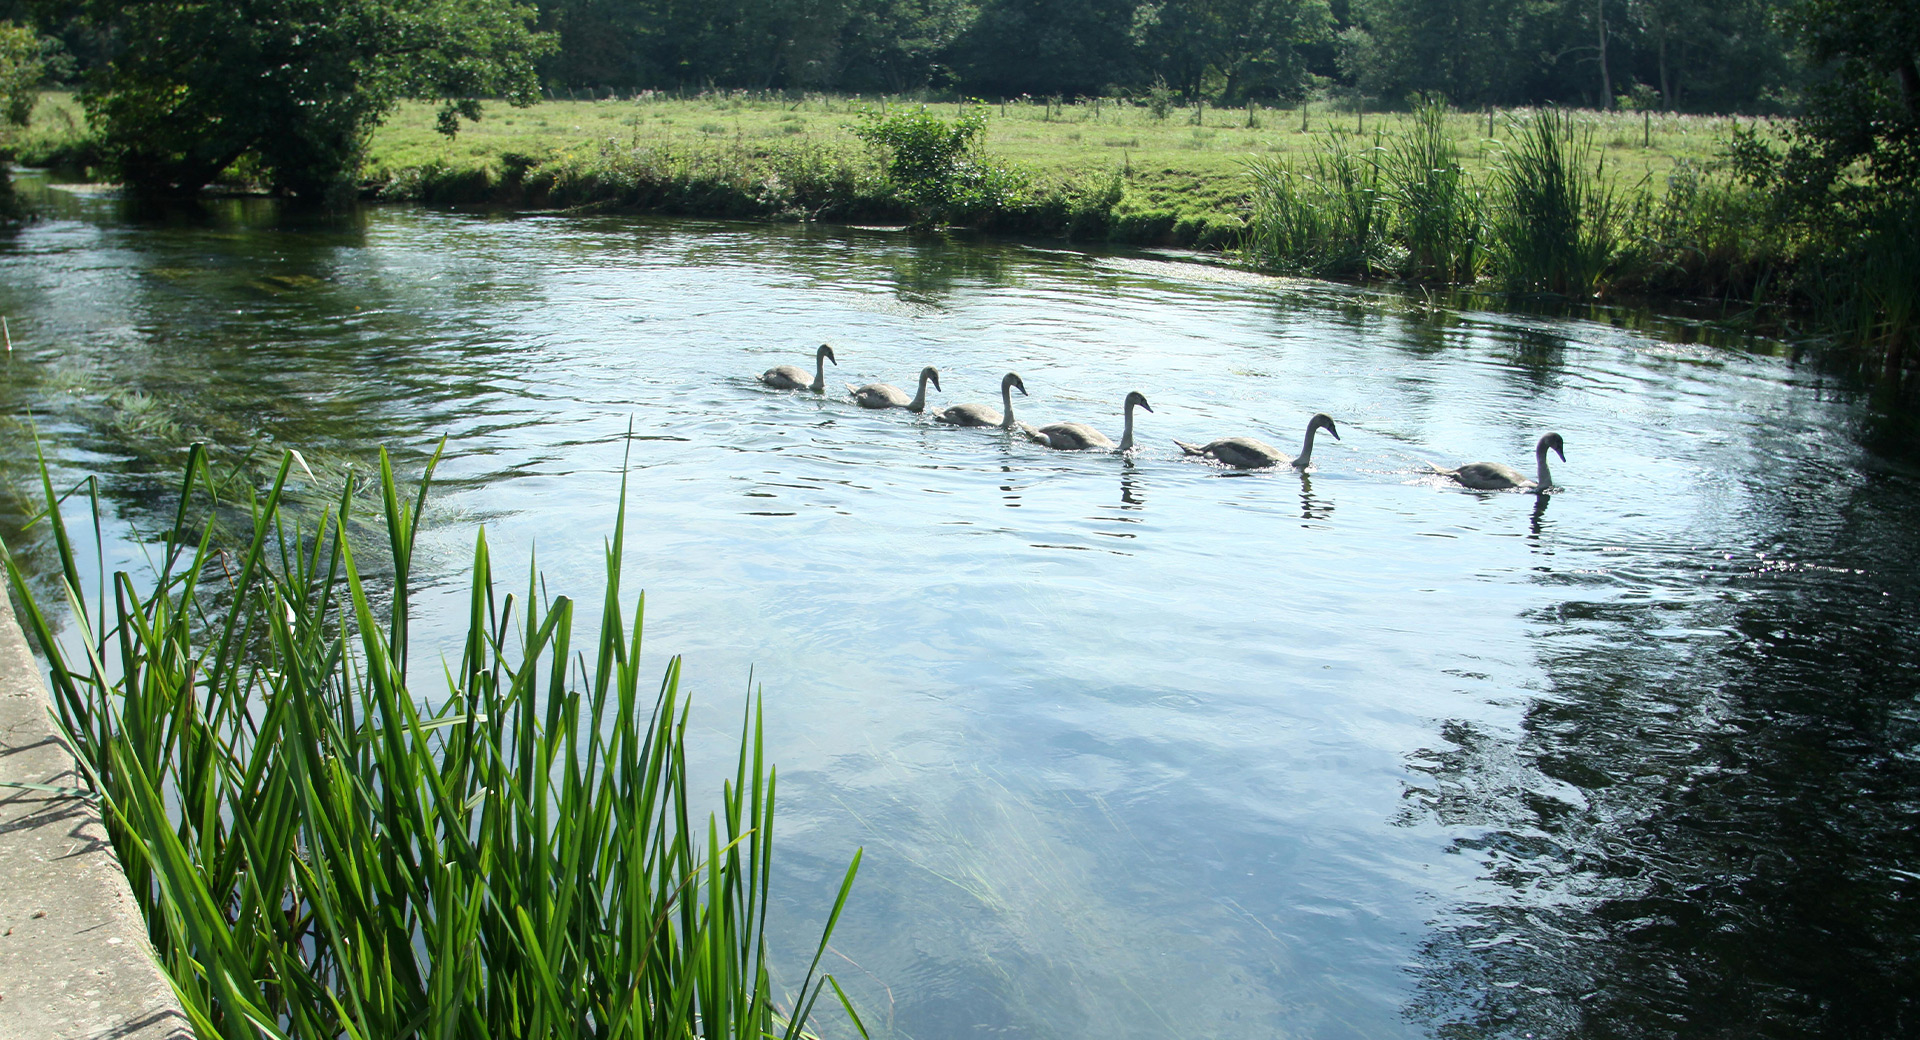
When it rains, some of the water runs into streams and rivers, while the rest soaks into the soil and slowly makes its way deeper underground, becoming part of the water table. This water collects in chalk and rock, forming the aquifers (natural underground water store) that feed our region’s much loved chalk streams, including the Test and the Itchen.

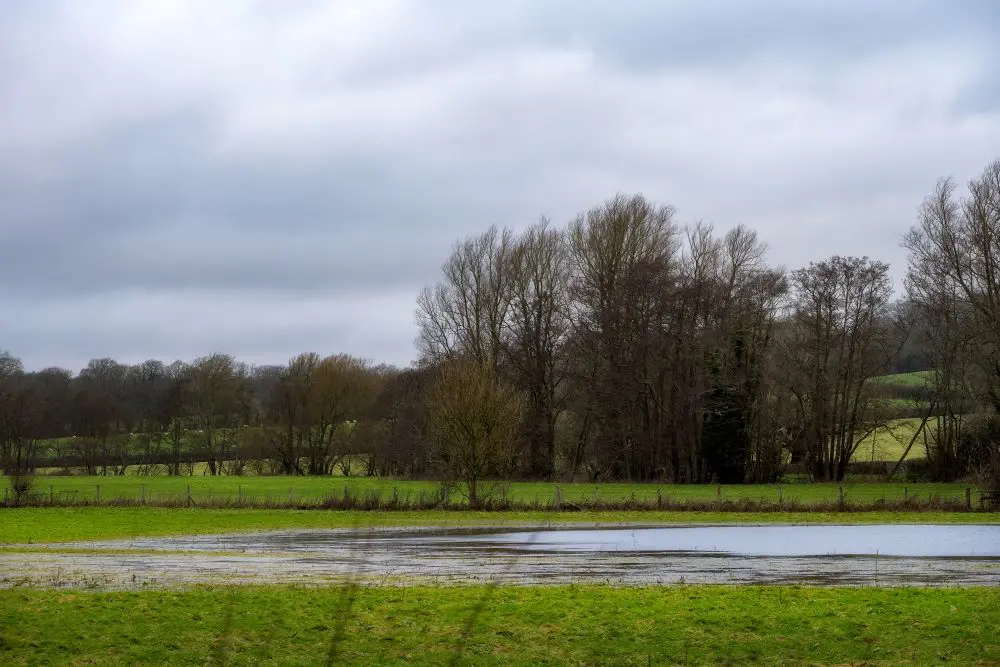
Because chalk holds water like a sponge, groundwater levels rise slowly and stay high long after the rain has stopped – especially in valleys, where villages sit closer to the water table. 

As levels continue to rise, groundwater can push up to the surface, causing flooding, and can also enter our sewer network. When this happens, it overwhelms systems built only for wastewater, reducing capacity and putting the network under pressure.

Although we’re not responsible for groundwater flooding, we do everything we can to help reduce its impact on our communities.

How we’re tackling problems with groundwater

Flooding is just one challenge. When groundwater enters the sewer network, it overwhelms systems designed only for wastewater, leaving less capacity and creating immense pressure. In severe cases, we use tankers to remove excess water, but this is only a short-term fix.

For long-term solutions, we:

  • Reline sewers to block groundwater.
  • Build wetlands – like in Lavant – to absorb excess rainwater.
  • Seal private pipes with Tubogel to prevent infiltration.

With extreme weather becoming more common, we’re investing in measures to protect our customers for the future.

How do we measure groundwater?

We receive updates from the Environment Agency and compile the data from readings taken at our indicator boreholes.

Groundwater is measured in Metres Above Ordnance Datum (mAOD). mAOD is based on the mean sea level at Newlyn in Cornwall and is used as the reference point to calculate height above sea level in the UK.

The graphs below show the latest groundwater levels compared to previous years. The red, orange and yellow lines show how the actual levels compare to what's considered as exceptionally or notably low. We publish monthly water levels the next month, after the full month is complete.

An aerial view of Weir Wood Reservoir

Hampshire North

The graph show the latest groundwater levels for Hampshire North compared to previous years. The red, orange and yellow lines show how the actual levels compare to what's considered as exceptionally or notably low. Monthly levels are published the following month once the full month is complete.

Hampshire South

The graph show the latest groundwater levels for Hampshire South compared to previous years. The red, orange and yellow lines show how the actual levels compare to what's considered as exceptionally or notably low. Monthly levels are published the following month once the full month is complete.

Isle of Wight

The graph show the latest groundwater levels for the Isle of Wight compared to previous years. The red, orange and yellow lines show how the actual levels compare to what's considered as exceptionally or notably low. Monthly levels are published the following month once the full month is complete.

Thanet

The graph show the latest groundwater levels for Thanet compared to previous years. The red, orange and yellow lines show how the actual levels compare to what's considered as exceptionally or notably low. Monthly levels are published the following month once the full month is complete.

Sussex Brighton

The graph show the latest groundwater levels for Sussex Brighton compared to previous years. The red, orange and yellow lines show how the actual levels compare to what's considered as exceptionally or notably low. Monthly levels are published the following month once the full month is complete.

Drought triggers

The drought status in any area is based on several factors including historic rainfall, groundwater and reservoir levels. If a groundwater drought trigger level is met this does not necessarily mean the overall drought status has changed.

Drought trigger curves are based on those in our current Drought Plan.