1. Overview for the Stour River Basin Catchment
You can find all the documents relating to the below in the downloads at the bottom of this page.
Our DWMP sets out our priorities for the Stour River Basin Catchment.
- Reducing the number of spills from the 74 storm overflows which together currently spill around 800 times per annum.
- Separating or attenuating excess rainwater in the sewer networks to reduce the risks of flooding and frequency of storm overflow discharges, especially in Kennington and Westbere.
- Investigating the potential impact of wastewater discharges on the Sarre Penn, River Wantsum and Great Stour and the measures needed to achieve Good Ecological Status.
- Reducing nutrient discharges from the WTWs across the river basin to prevent deterioration of the Stodmarsh internationally designated habitat site.
- Developing a nutrient budget by investigating the sources impacting Stodmarsh.
- Planning for potential significant development at Chilmington Green, Whitfield, Birchington, Westwood, Westgate-on-Sea, Canterbury, Aylesham, Whitstable, Folkestone and Otterpool Park Garden.
- Improving the resilience of our networks and treatment works to prevent pollution incidents, particularly in Dover, Folkestone, Whitstable, Swalecliffe, Chartham and Preston.
- Reducing the risk of sewer blockages by increasing sewer jetting and targeting customer campaigns to reduce the amount of fat, oil and grease (FOG) and non-flushables in the sewer network around Margate, Broadstairs, Ramsgate, Deal and Walmer.
- Reducing the risk to groundwater by reducing leakage from our sewers in the Dover, Walmer, Ramsgate, Hawkinge and Capel-le-Ferne areas.
All the stages we followed in developing the DWMP for the Stour are set out in the subsections below.
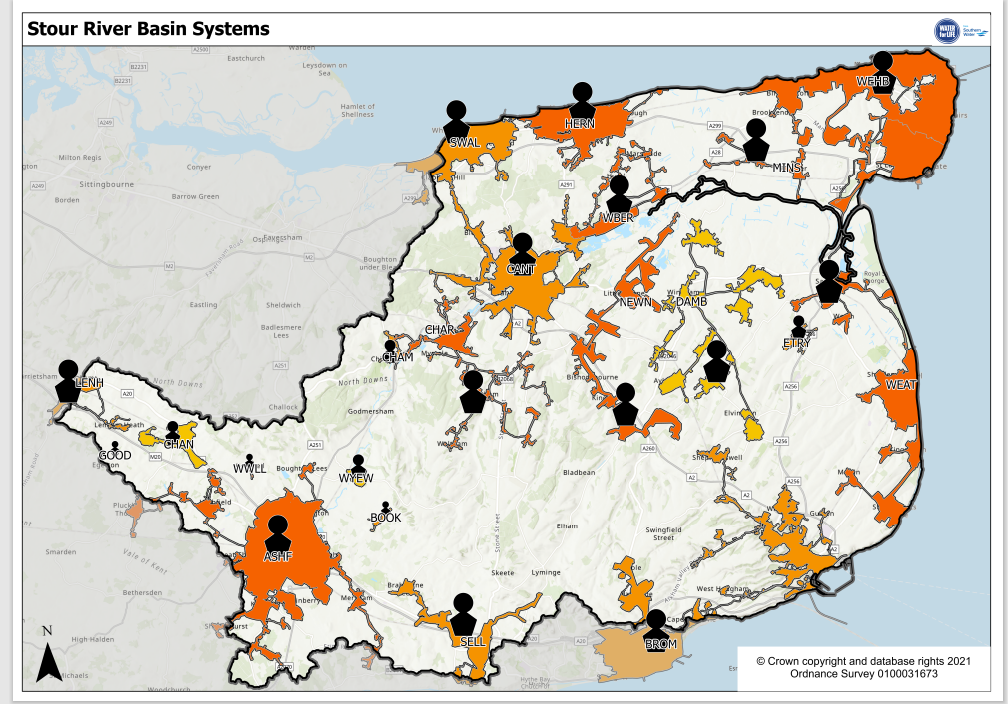
Stour River Basin Catchment
Across the Stour River Basin Catchment we have:
Stour River Basin Catchment
Across the Stour River Basin Catchment we have:
21
Sewerage catchments
5,325
Kilometres of sewers
21
Wastewater Treatment Works
455
Wastewater Pumping Stations
16%
The percentage of the region connected to a mains sewer
96%
The percentage of homes connected to a mains sewer
89%
The percentage of businesses connected to a mains sewer
2. Working with others
We've worked with a wide range of organisations with responsibilities for drainage, flooding and protection of the environment while developing our DWMP. The organisations we worked with in the Stour River Basin Catchment include:
- Kent County Council
- River Stour Internal Drainage Board
- Canterbury City Council
- Dover District Council
- Folkestone and Hythe Borough Council
- Maidstone Borough Council
- Thanet District Council
- The Environment Agency
- Natural England
- The East Kent Catchment Improvement Partnership and member organisations including:
- Kent Wildlife Trust
- High Weald Area of Outstanding Natural Beauty
- South East Rivers Trust
Working together to co-create the DWMP is important. Our drainage and wastewater systems are often interconnected with the systems managed and operated by others and affect the natural environments within the catchment.
Issues and concerns
A wide range of issues and concerns have been raised and discussed throughout the development of the DWMP for the Stour. We're progressing these issues through the development of the DWMP as set out in our investment needs for the Stour. Furthermore, we commit to working with others to co-develop and co-deliver schemes that meet multi-organisational objectives and which benefit the environment, our customers and communities.
3. Workshop presentations
We developed and ran a series of activities between 2020 and 2022 as we prepared our DWMP for the Stour River Basin. This included regionally-based webinars presented and discussed issues and information relevant across the whole of our operating region. You can view the presentations used in the webinars on our Who we’re working with page.
Workshop 1
Held in September 2020, participants discussed the findings of the risk based catchment screening (RBCS) and proposed additional planning objectives for the DWMP.
Workshop 2
Held in April 2021, participants:
- discussed the results from the BRAVA risk assessments and the proposed investment strategy for the wastewater catchments within the Stour River Basin Catchment
- identified the generic options that should be explored to address the identified risks, and
- discussed which wastewater catchments to progress through the Options Development and Appraisal stage of the DWMP.
Workshop 3
Held in March 2022, we reviewed and discussed the draft investment programme for the Stour River Basin Catchment. This included the types of investment, priorities and timing for investment needs and the wider opportunities arising from the proposed investment in terms of partnership projects and catchment-wide solutions providing multiple benefits.
You can also view the findings from our interim consultation.
4. Risk based catchment screening for the Stour catchment
Risk based catchment screening (RBCS) is a process that uses existing, readily available data. This data helps us identify where there's a current and/or potential risk or vulnerability in the sewer catchment to future changes, such as new residential development or changes in climate. This enables effort to be focused on these catchments during the development of the DWMP in order to understand these risks in more detail and why they're likely to occur.
The RBCS involves the assessment of each sewer catchment against 17 indicators set out in guidance published by Water UK. Water companies can add additional indicators to ensure that other important issues are highlighted at this early stage in the development of the DWMPs. We've included an additional metric on customer complaints as this provides a flag for catchments with ongoing or outstanding concerns.
Find out more about the risk based catchment screening process.
5. BRAVA for the Stour River Basin Catchment
The Baseline Risk and Vulnerability Assessment (BRAVA) is an important step in the development of our DWMP. It helps us understand current system performance and future vulnerabilities. This means that we can identify the investment needed to manage and reduce the risks to band 0 (no significant level of risk).
A BRAVA assessment has been completed for each of the wastewater systems in the Stour Catchment that were flagged during the RBCS. A risk assessment is completed for all 14 planning objectives.
The output of the BRAVA shows:
- the current risks and issues in each wastewater system within the Stour Catchment – providing a baseline from which we can assess future risks
- the future risks in 2030, 2035, 2045 and 2050 (where the methodology currently allows us to assess the future risks) so we can understand how the current risks may change without additional investment
- the key issues behind the future changes in risk, including:
- a deterioration in the condition of our wastewater systems
- climate change – including the increasing frequency and severity of droughts and storms
- growth and urban creep
- a combination of any or all of these that are relevant in the catchment being assessed.
Notes
- In the BRAVA results table, “not flagged” means no risks were identified in the initial RBCS using the nationally set criteria. Wastewater systems not flagged were screened out and did not progress to the BRAVA stage. “Not applicable” means the planning objective wasn't relevant within the wastewater system. For example, where a system has no storm overflows, this will be marked as “Not applicable”.
- Please check the DWMP glossary for any unexplained acronyms.
6. Problem Characterisation
The Problem Characterisation stage of the DWMP uses the results from the Baseline Risk and Vulnerability Assessment (BRAVA) to explore the causes of risks and the primary drivers. A technical summary provides information on our approach to the Problem Characterisation stage.
Current risks in the Stour Catchment
The combined results of the 2020 BRAVA assessment for all 21 wastewater systems in the Stour River Basin Catchment shows how many wastewater systems have a risk under each of the 14 planning objectives. For example, for the risk of internal flooding, 10 wastewater systems are in band 0 (not significant), five are in band 1 (moderately significant), five are in band 2 (very significant) and one was ‘not flagged’ for inclusion (i.e. screened out at the RBCS of the DWMP).
Pollution, flooding in a 1-in-50-year storm event and good ecological status/potential are the main concerns in this river basin.
The wastewater systems with the highest number of planning objectives in band 2 (very significant) are Swalecliffe and Weatherlees Hill, each with seven objectives in band 2. Along with Sandown on the Isle of Wight, these two systems have the greatest number of risks for 2020 across our entire region. Chartham and May Street, Herne Bay each have five band 2 risks. Two wastewater systems, Broomfield Bank and Westwell have four planning objectives in band 2. All other catchments have fewer risks.
The specific risks and the causes of risk for each of the wastewater systems are explained in the summary of the problem characterisation for each system.
Future risks in the Stour Catchment
The 2050 BRAVA results help us to identify the future challenges for drainage and wastewater management in the Stour River Basin Catchment.
(a) Growth
There are several wastewater catchments where new homes, businesses, roads and other infrastructure are planned. The main areas identified for potential new development in the Stour Catchment are:
- Ashford
- Margate and Broadstairs
- Herne Bay
- Weatherlees Hill
- Canterbury
The BRAVA results show that the additional homes and businesses will increase the risks of non-compliance with our Dry Weather Flow (DWF) permits from the Environment Agency in nine of the 21 wastewater systems. This includes Weatherlees Hill, Ashford, Canterbury, May Street, Herne Bay, Dambridge Wingham, Newnham Valley, Preston, Chartham and Minster. This means further investment will be needed in the future to increase the capacity of our treatment works to accommodate the new homes and businesses.
The additional development may mean that our current permits for wastewater treatment quality might be exceeded by 2050 without further investment in three wastewater systems, Broomfield Bank, Westbere and Chilham.
New development in the Stour Catchment might put additional pressure on internationally designated habitat sites such as Stodmarsh and Thanet Coast. So, solutions will need to be found to ensure that any development is nutrient neutral.
A map of the Stour Catchment showing the estimated future growth in each wastewater system is shown below. The technical summary explains how we've considered population growth and urban creep in our DWMP.
(b) Climate change
Climate change will bring greater variability of our weather with warmer wetter winters and hotter drier summers. As a result, we could be seeing more intense summer storms that exceed the capacity of the drainage and wastewater networks and cause localised flooding. Hence, the risk of flooding from sewer systems is increasing due to climate change. The technical summary explains how we've considered climate change in our DWMP.
We'll work with partner organisations, such as Kent County Council and the Environment Agency, who have responsibility for flooding and drainage, to consider options and develop opportunities to find solutions that reduce the risks from flooding.
We'll need to adapt our wastewater systems to operate in future climates. There will be an increasing need to slow the flow entering our sewer networks so the systems can carry the water without flooding homes and businesses and/or without causing discharges from storm overflows. Preventing additional rainfall from entering foul sewer networks, including combined sewer networks where possible, could delay the need to upgrade and enlarge the vast underground network of sewers.
Climate change is expected to have an impact on the risk of flooding in several wastewater systems, especially Weatherlees Hill, Canterbury, Swalecliffe, Chartham, Westbere, Eastry and Wye. The flooding risk will increase by 2050 unless measures are taken to manage and reduce these risks.
The risk of storm overflow discharges is forecast to increase for several wastewater systems including Margate and Broadstairs as well as Weatherlees Hill. However, the BRAVA results indicate that two systems, Herne Bay and Swalecliffe, already have a very significant risk of discharges from storm overflows.
The map below shows the potential impact of climate change, urban creep and growth on the risk of flooding in a 1-in-20-year storm for the wastewater systems. We followed Water UK’s capacity assessment framework to apply a 20% uplift to rainfall forecasts to assess the potential increases in flood volumes shown on the map. Swalecliffe and Herne Bay are shaded in red as there could be more than 1,000 properties at risk from flooding from sewers by 2050. The flood volumes could increase from 17,355 to 24,662m3 in Swalecliffe, and from 4,096 to 8,263m3 in Herne Bay. This is a large increase in forecast flood volumes due to the likely changes in weather patterns.
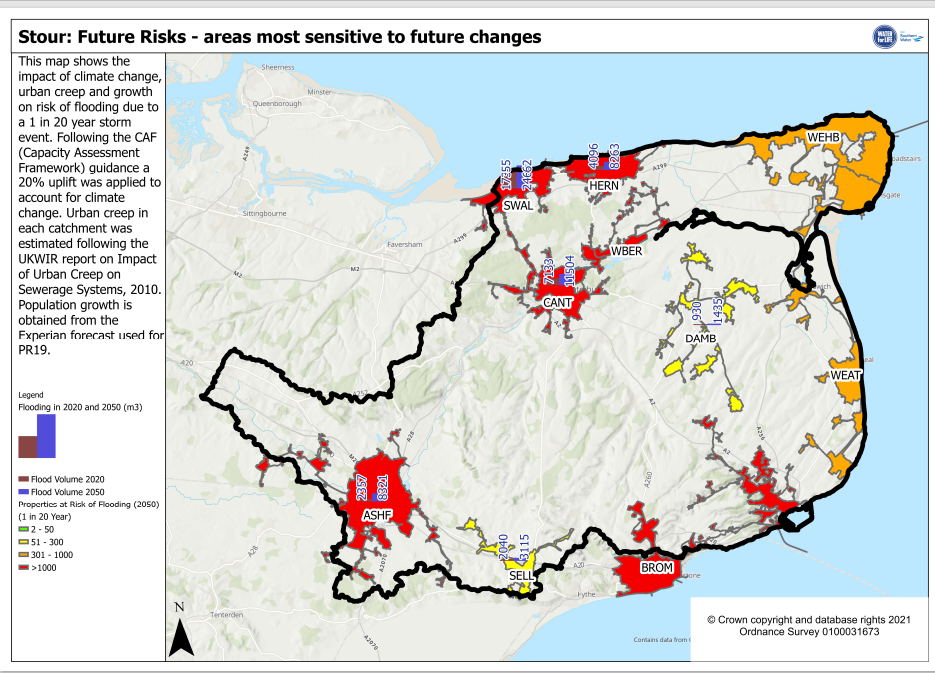
Urban creep was estimated using the approach developed by the UK Water Industry Research (UKWIR) report on Urban Creep in sewerage systems (2010).
The map highlights that we'll need to adapt to climate change. Adaptation will mean considering long-term sustainable options, such as reducing the volume of rainwater entering the sewer network. This approach may provide the capacity within the wastewater system to allow for future growth, therefore reducing both the need for significant increases in the capacity of the existing wastewater systems and reducing discharges from storm overflows.
Investment planning for each wastewater system
We used the BRAVA results and our understanding of the causes of risks and drivers to propose an investment strategy for each of the wastewater systems. Find out more information on how we determined the investment strategies. These strategies help us to target the wastewater systems that need further investment to reduce the potential risks to customers and the environment. We've produced a table that lists the proposed investment strategy for each catchment.
We used a risk-based approach to identify the wastewater systems that we need to progress in this first round of DWMPs. For these systems, we'll develop an investment plan. Our technical summary sets out how we selected the systems to take forward.
We'll publish the maps and causes of risks for the remaining wastewater systems in the Stour when available.
7. Options Development and Appraisal
Our approach to Options Development and Appraisal (ODA) is explained in a technical summary.
Generic options
We commenced the ODA process at the river basin catchment (RBC) scale (level 2 planning). This enabled us to look across all the wastewater systems in the river basin and consider generic options that could work at the catchment scale, as well as those specific to a wastewater system.
The generic options are grouped into those that help tackle the risks ‘at source’, those that help to improve the wastewater system, ‘the pathway’, and those that protect or mitigate the impacts on the receiving waterbodies, ‘the receptors’. This process helped to identify the types of options that could be used individually or in combination with other options to address the risks.
We held meetings with partner organisations to build upon the list of generic options relevant to each wastewater system. As a group, we identified and proposed ‘unconstrained’ options to tackle the drivers and causes of risks identified during the Problem Characterisation stage of the DWMP. We then progressed these unconstrained options through the Options Development and Appraisal.
Options development
The options development involved evaluating each of the options in two stages. Firstly, to screen out unviable options to leave a set of ‘constrained’ options. Then, a second stage helped us to reduce the list further to leave only potentially ‘feasible’ options (see the Options Development and Appraisal technical summary for full details of this process). The process for evaluating the benefits and how we've taken the environment into account is set out in our Strategic Environmental Assessment (SEA) Scoping Report and the SEA Progress Report.
Only feasible options with positive benefits proceeded to the costing stage and this resulted in the selection of the preferred options and confirmed whether each was ‘least cost’ or provided ‘best value’.
The feasible options column in the table below shows how we applied the process within each wastewater system. Beginning with the generic options through the appraisal stages, the table shows the point at which some options were rejected and why. If an option wasn't rejected, it was costed and became either the final best value or the least cost preferred option (see ODA technical summary for details of this process).
Our final preferred options are set out in the Investment Needs tables for each wastewater system. The accompanying maps show the location of the proposed options within the wastewater system.
Please check the DWMP glossary for any unexplained acronyms.
The options and investment needs are not committed funding but an identification of the needs for funding. We'll include these options in our future business plans as part of the Ofwat periodic review of Water Company funding to secure the investment needed to implement these options.
8. Programme Appraisal
The Programme Appraisal stage of the DWMP follows the Options Development and Appraisal (ODA) process. The ODA process identified the preferred options for investment in our wastewater systems to reduce the current risks as well as the risks up to 2050.
The Programme Appraisal brings the investment needs for each wastewater system together into an investment needs programme for the Stour Catchment. We look across the catchment to review the investments needed, the timing of these needs and how they combine to reduce the risks to our customers and the environment.
We also look at the wider risk reduction that each option provides across all the planning objectives. Some actions, like separating rainwater from wastewater sewers, could reduce risks under several planning objectives such as storm overflows, external flooding, bathing water quality, shellfish water quality and good ecological status. You can find the details of the method for prioritisation in our Technical Summary on Programme Appraisal.
The investment needs for the Stour River Basin Catchment include:
- reducing the number of spills from the 74 storm overflows which together currently spill around 800 times per annum
- separating or attenuating excess rainwater in the sewer networks to reduce the risks of flooding and frequency of storm overflow discharges, especially in Kennington and Westbere
- investigating the potential impact of wastewater discharges on the Sarre Penn, River Wantsum and Great Stour and the measures needed to achieve Good Ecological Status
- reducing nutrient discharges from the WTWs across the river basin to prevent deterioration of the Stodmarsh internationally designated habitat site
- planning for potential significant development at Chilmington Green, Whitfield, Birchington, Westwood, Westgate-on-Sea, Canterbury, Aylesham, Whitstable, Folkestone and Otterpool Park Garden
- improving the resilience of our networks and treatment works to prevent pollution incidents, particularly in Dover, Folkestone, Whitstable, Swalecliffe, Chartham and Preston
- reducing the risk of sewer blockages by increasing sewer jetting and targeting customer campaigns to reduce the amount of fat, oil and grease (FOG) and non-flushables in the sewer network around Margate, Broadstairs, Ramsgate, Deal and Walmer
- reducing the risk to groundwater by reducing leakage from our sewers in the Dover, Walmer, Ramsgate, Hawkinge and Capel-le-Ferne areas.
Investment Needs for the Stour River Basin Catchment
We progressed nine wastewater systems through the ODA stage in the first cycle of the DWMP. These nine wastewater systems serve a population of around 471,000 which is approximately 80% of customers in this river basin catchment.
We extrapolated the investment needs for these nine systems to the other 12 systems in the catchment. This provides an estimate of the total investment needs required to reduce the risks in all our wastewater systems in the catchment to band 0 (not significant). This concept of “Band Reduction” and full details of the process for extrapolation are explained in the Technical Summary on Programme Appraisal.
The programme appraisal for the Stour identified the following needs.
- The nine wastewater systems serve a population of around 471,000 which is approximately 80% of customers in this catchment.
- A total of 111 band reductions are required in 2020 across the 14 planning objectives for the nine wastewater systems.
- By 2050, this will increase to 129 band reductions due to the impact of climate change, growth and creep.
- The options identified to date would cost around £727 million for the nine systems and are expected to provide 59 band reductions by 2050 (the options do not result in a band 0 for all risks).
- The Stour has 21 systems which require 168 band reductions in 2020 and 198 band reductions by 2050 in order to achieve band 0 across 14 planning objectives.
- Extrapolating the investment needs for all the systems in the Stour will cost around £1.79 billion for a population of 592,000. This illustrates the scale of investment needed to get to band 0 by 2050.
These investment needs provide indicative costs that allow us to understand the level of funding required to reduce the risks. The funding hasn't been secured at this stage. The DWMP informs the development of our 5 yearly Business Plan which is submitted to our economic regulator, Ofwat, to agree on how we should invest the money received from our customer bills.
Consultation on the Stour River Basin Catchment
We held a preliminary consultation on our draft DWMP in September and October 2021. The purpose of the consultation was to gain feedback and advice from our customers and organisations on our developing Plan.
We specifically asked about:
- our Strategic Environmental Assessment Scoping Report
- our selection of wastewater systems to take forward into the Options Development and Appraisal stage of the DWMP in the first cycle, and
- our developing plans for each of the 11 river basin catchments.
Our report on the initial DWMP consultation is now available.
When we consulted on the developing plans for the Stour River Basin Catchment, you highlighted key issues that we needed to take into consideration.
- The rising trend of pollution in the groundwater along with groundwater vulnerability has not been picked up.
- There are a series of smaller wastewater treatment works which have high or no consent levels for nutrients while there has been lots of cumulative development. This, combined with low levels of monitoring, means there are risks to the catchment which may be missed or misunderstood.
- There are significant nutrient risks and impacts on Stodmarsh which will likely worsen with the levels of growth that are planned. Improved data and monitoring are required to develop an evidence-based approach to neutrality and ensure that the systems have sufficient capacity.
- There are too many catchments in the ‘improve’ category.
How we responded to the issues raised during the workshops and the preliminary public consultation is set out in our Register of Stakeholder Comments.
We held a full 12-week public consultation on the draft Regional (Level 1) DWMP between Monday 13 June and Monday 05 September 2022. Our Statement of Response and a report and analysis on the consultation is published on the Have your say page.