Our pollution reduction programme
Our Pollution Incident Reduction Plan (PIRP) strategy has laid the foundations for a continued improvement in our performance, showing trends from all sources, including electrical and mechanical (MEICA), blockages and bursts, as well as pollutions from sewer blockages. As part of the strategy, we have installed 23,000 sewer level monitors to send water level data back to a powerful machine-learning tool, focusing on areas where blockages happen most frequently.
Our pollution reduction programme will continue to deliver a big step-change in how we work, prioritise and remedy issues on our sites. This includes focusing our attention and investment on areas which will deliver the biggest reduction in incidents.
We've made further changes to the Pollution Incident Reduction Plan (PIRP), which sets out how we'll aim to reduce the annual number of pollutions from 483 in 2022 to less than 130 by the end of 2024 and zero by 2040. The PIRP strategy has already laid the foundations for a continued steady improvement in our performance, informing future plans by showing the trends in pollutions from all sources, including electrical and mechanical (MEICA), blockages and bursts, as well as pollutions from sewer blockages.
Our 2023 Improvement Plans are focused on three main categories containing 18 separate initiatives delivering a benefit reduction of between 126–212 pollutions.
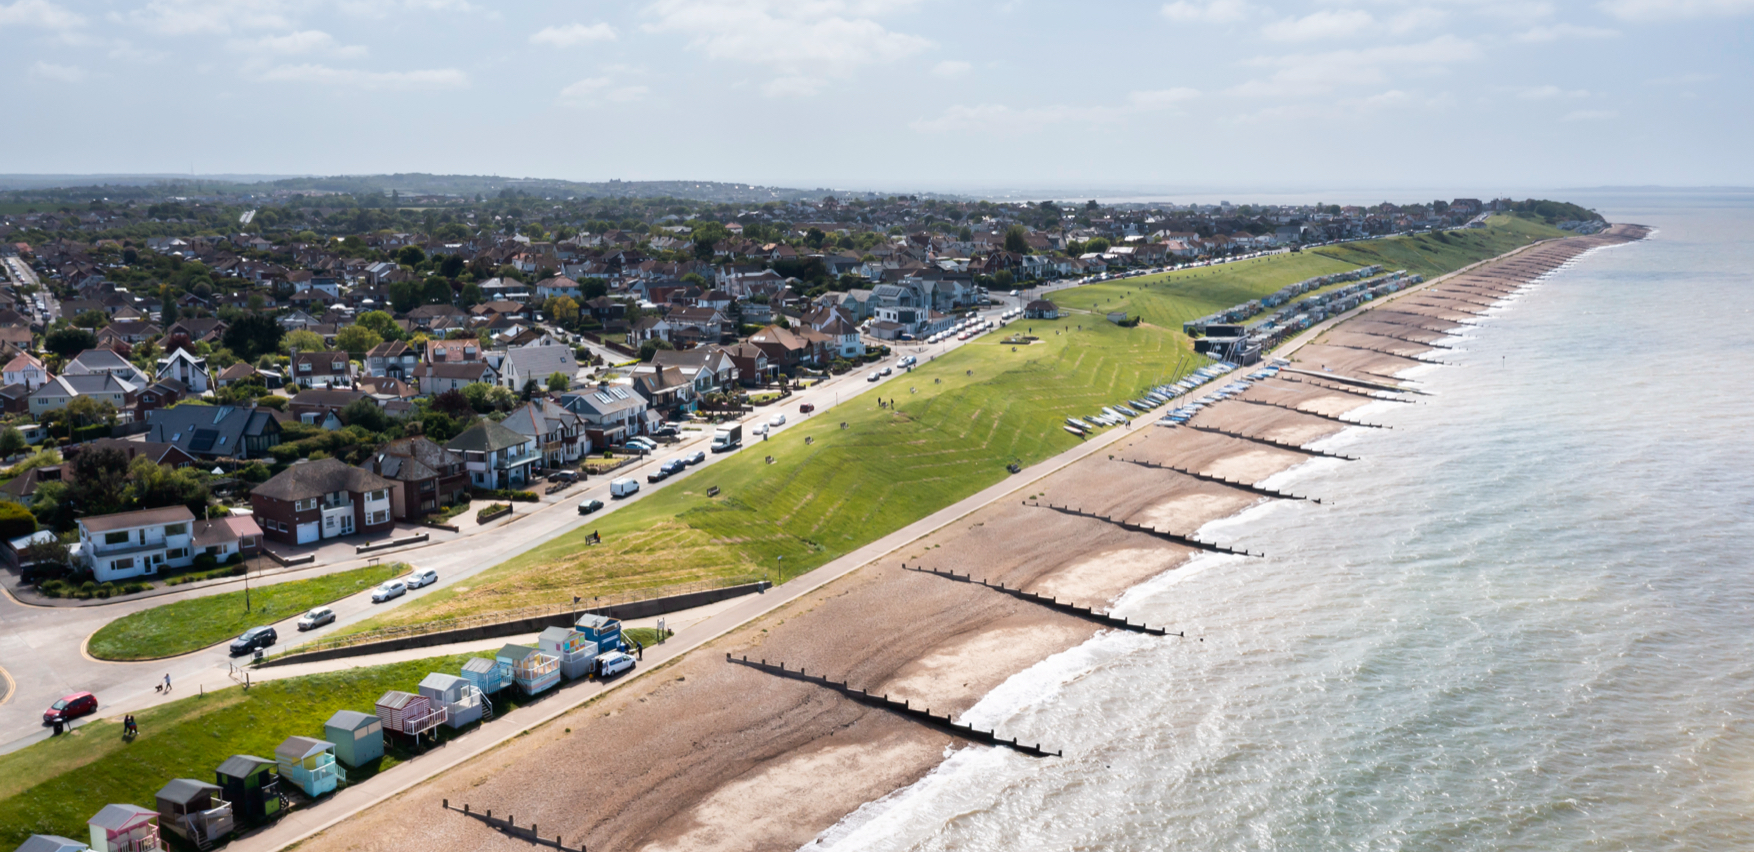
As part of our zero-tolerance approach to pollution, we've created a Clean Rivers and Seas Task Force to help us cut storm overflows by 80% by 2030.
You can help too. If you see something that you think might be pollution, please let us know straight away by using our simple report a pollution form. Together, we can protect and improve the environment.
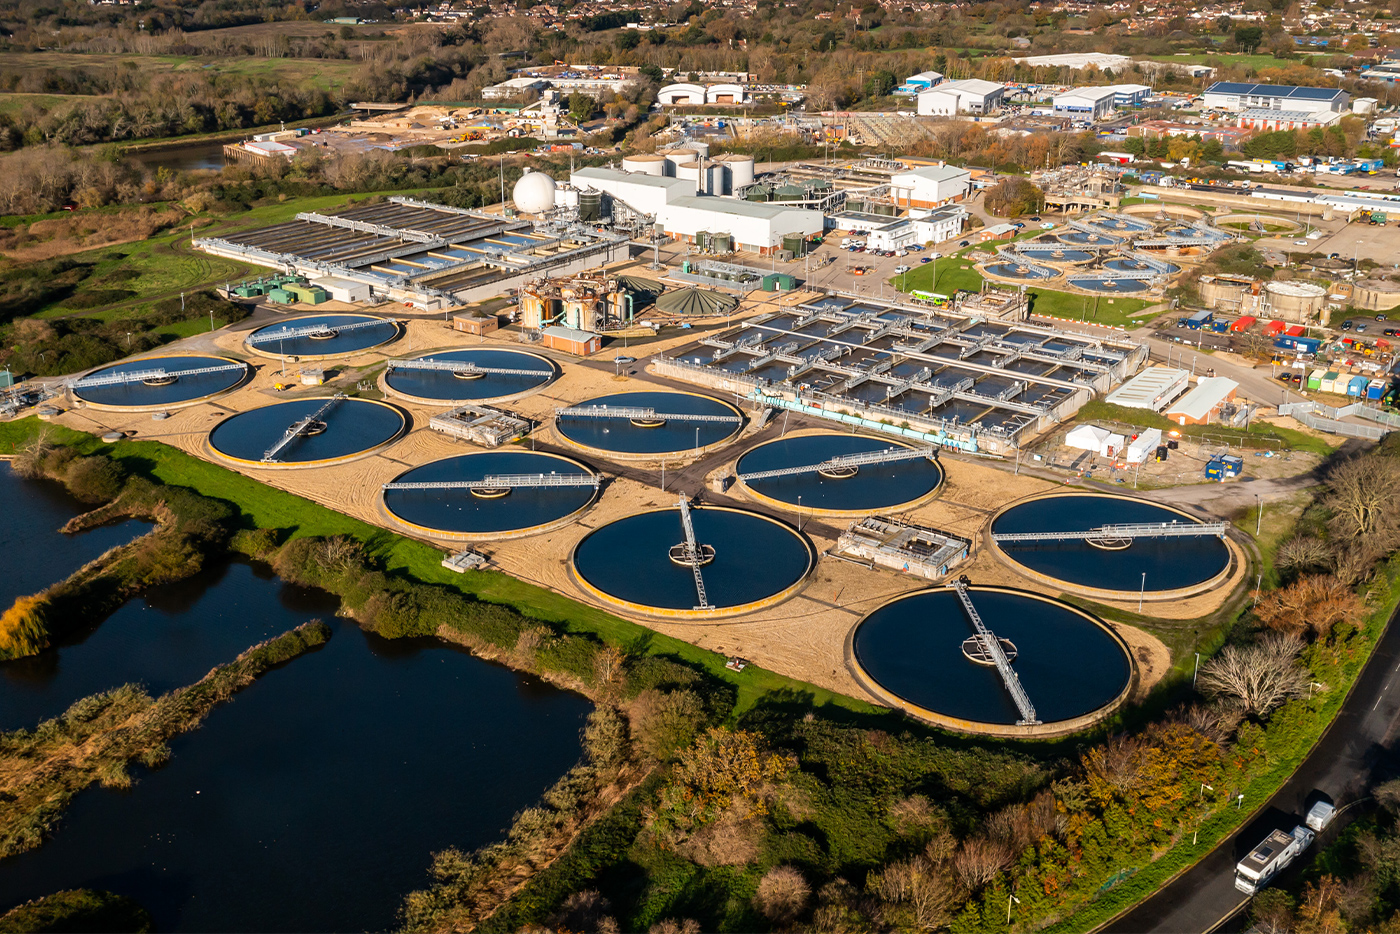
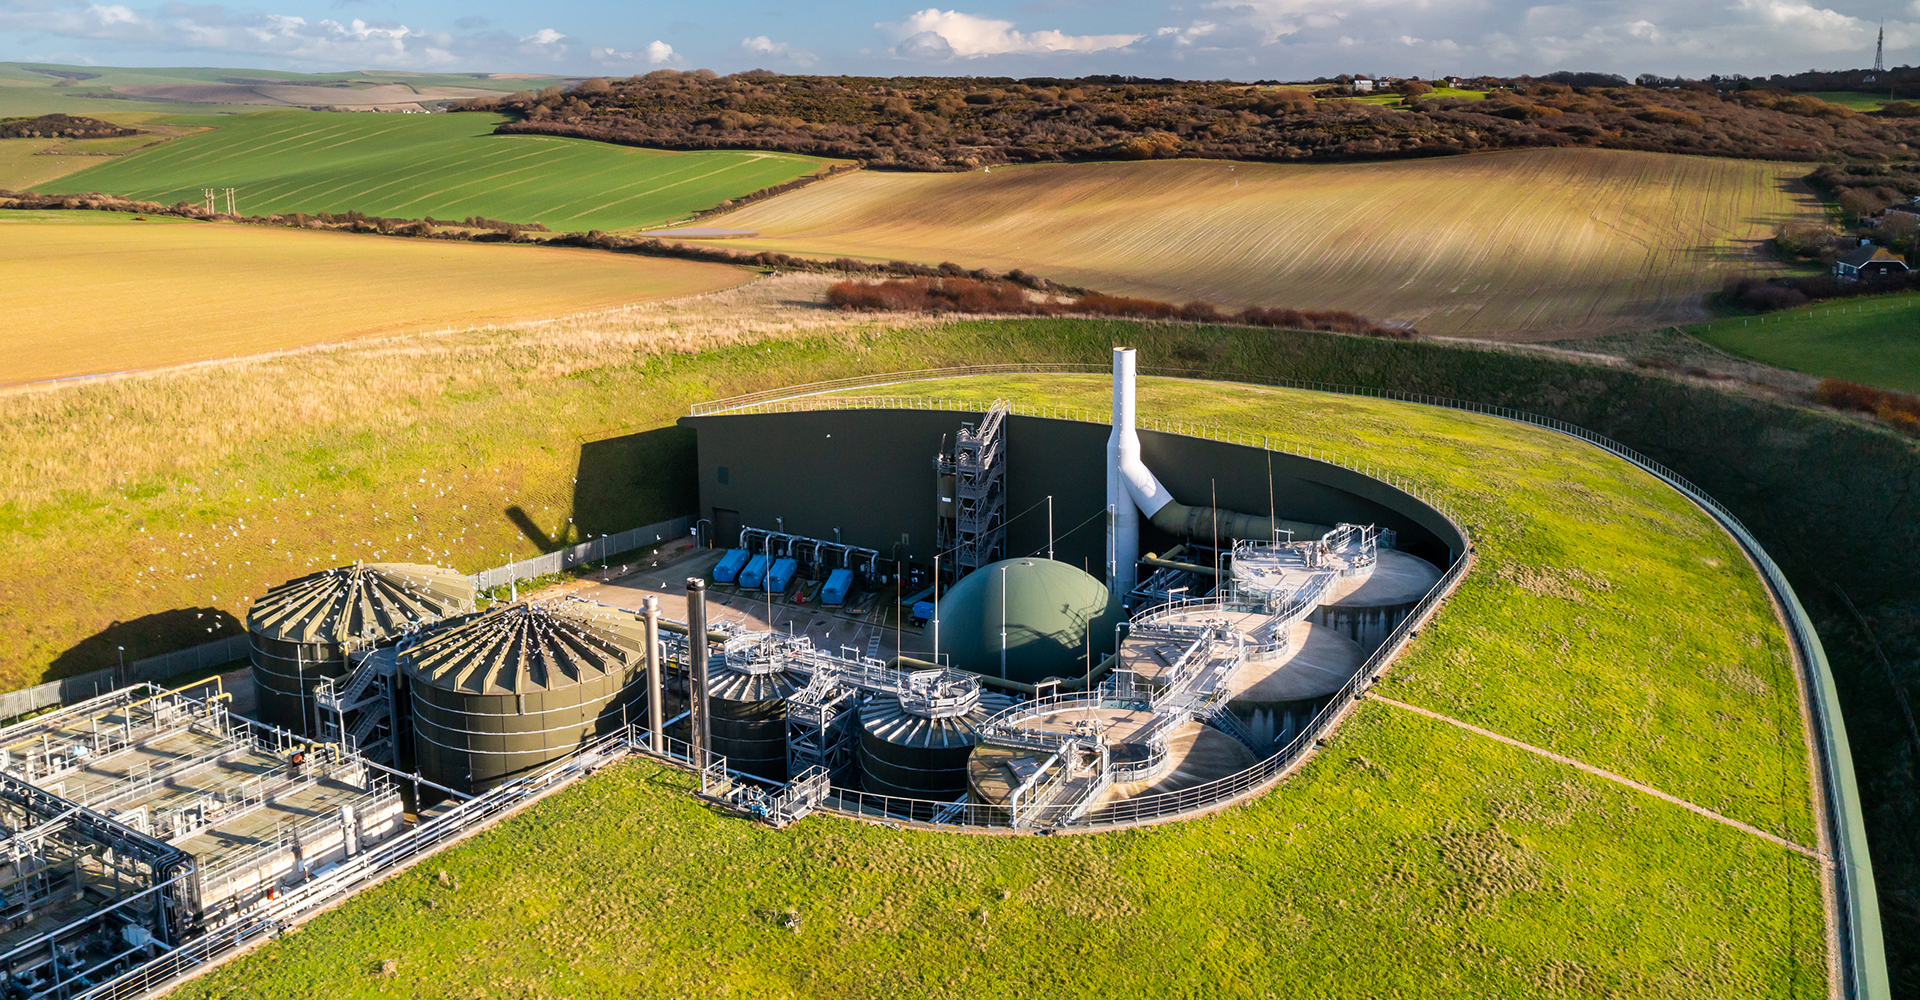
Drainage and wastewater management
Drainage and wastewater management is essential for a strong economy, a safe society and a healthy environment. We've developed Drainage and Wastewater Management Plans to plan for the future of drainage, wastewater and environmental water quality across our region.